
Knowledge Risk Summary
Knowledge risk is computed from a weighted average of the expert opinion elicited about each knowledge item.
Between 2 and 8 parameters may be used in the risk calculation from a list of over 30 available parameters. Parameter weights affect the weighted calculation. Zero weights mean that those parameters are not taken into account when calculating risk.
The equation which was used to calculate risk in this case is shown below.
(1.0*P1 + 1.0*P2 + 1.0*P3 + (10.0 - 1.0*P4) + 1.0*P5 + 1.0*P6 + (7.0 - 0.7*P7) + 1.0*P8) / 7.7
| Identifier | Name | Weight |
P1 |
Importance |
1.0 |
P2 |
Recovery |
1.0 |
P3 |
Study-Exp |
1.0 |
P4 |
StaffAvailable |
-1.0 |
P5 |
StaffNeeded |
1.0 |
P6 |
Specialised |
1.0 |
P7 |
Stability |
-0.7 |
P8 |
LearnTime |
1.0 |
The 10% of knowledge from the study that is at highest risk is listed below.
| Risk Value | Knowledge Name |
6.57 |
manpower capabilities |
6.52 |
Customer Services |
6.44 |
Diagnose faults |
6.39 |
Diagnostics fault finding methods |
6.39 |
Site survey |
6.35 |
System configuration |
6.35 |
Design service improvements |
6.26 |
System diagnostics |
6.26 |
Service Evaluation |
6.26 |
Establish evaluation criteria |
6.22 |
Design service evaluation schemes |
The average risk for the entire knowledge structure is 4.451. Whilst the average risk of the highest ten percent of the knowledge is 6.365.
The highest risk knowledge elements shown in the table above are those elements of Knowledge from the Knowledge Study that require more urgent attention. The formulae used to compute risk shows why these knowledge elements are considered to be the highest risk elements from the study.
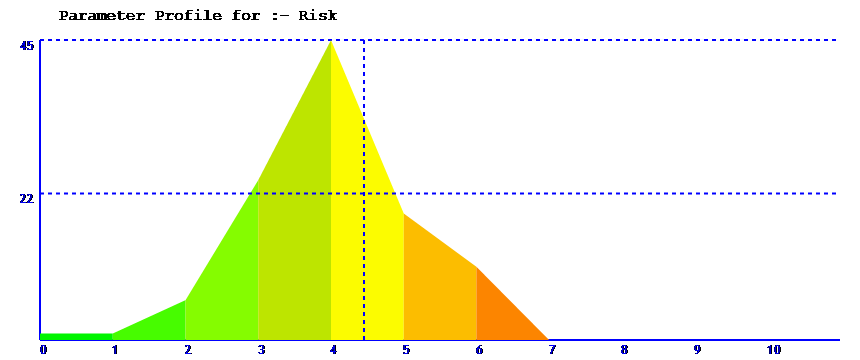
Spread of Knowledge Node RISK values against number of nodes

The average risk value for this map is 4.45
This chart shows how many low, medium and high risk knowledge elements there are in the Knowledge Structure Map. Where low risk knowledge has a risk value approaching zero and high risk knowledge has a risk value approaching ten. The values on the chart are for whole numbers only but these can be compared with the figures for the top 10% of high risk knowledge elements calculated to two decimal places, in the table above.


